
It is possible to visualise data from ClockWise within Power BI. This could be done via the Data Connector. In this manual it is explained how to configure the data connector to get the right data from ClockWise.
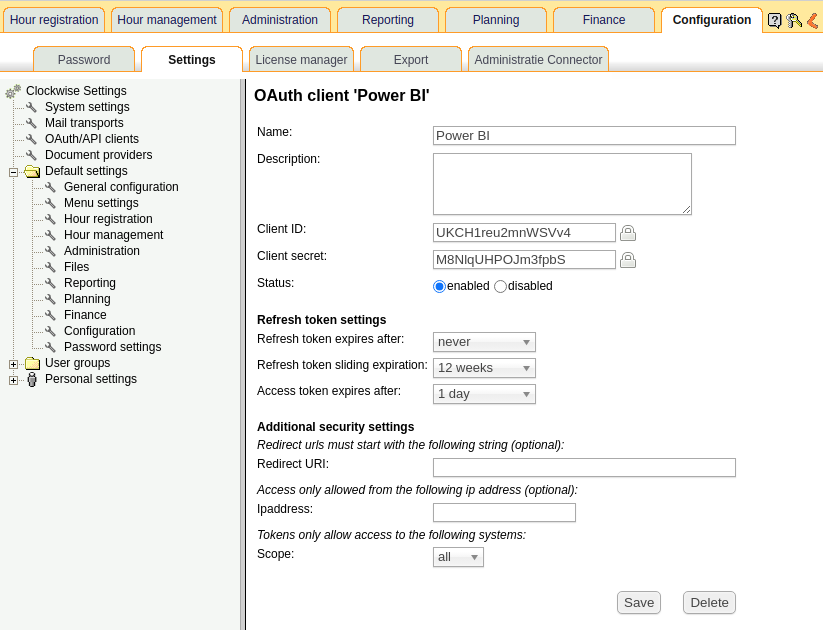
To be able to work with Power BI, you need an API client. This could be done within ClockWise in Configuration → Settings → OAuth/API clients. Click on 'Add OAuth client' and give a name to the client (e.g. Power BI). Note: We need the Client ID and Client secret which are generated on this page, so note these or keep the page of the API Client open while creating the connection.
Download the ClockWise Data Connector versie 1.0 from our website.
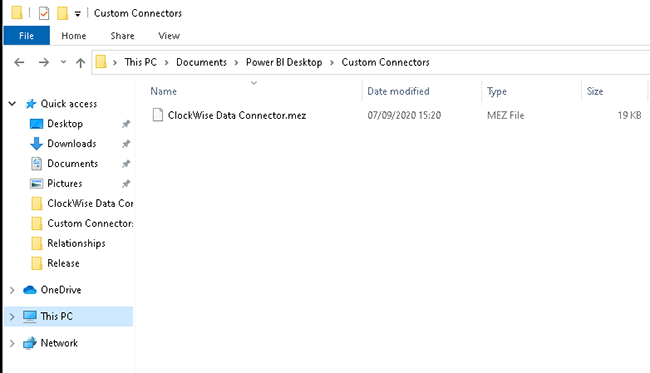
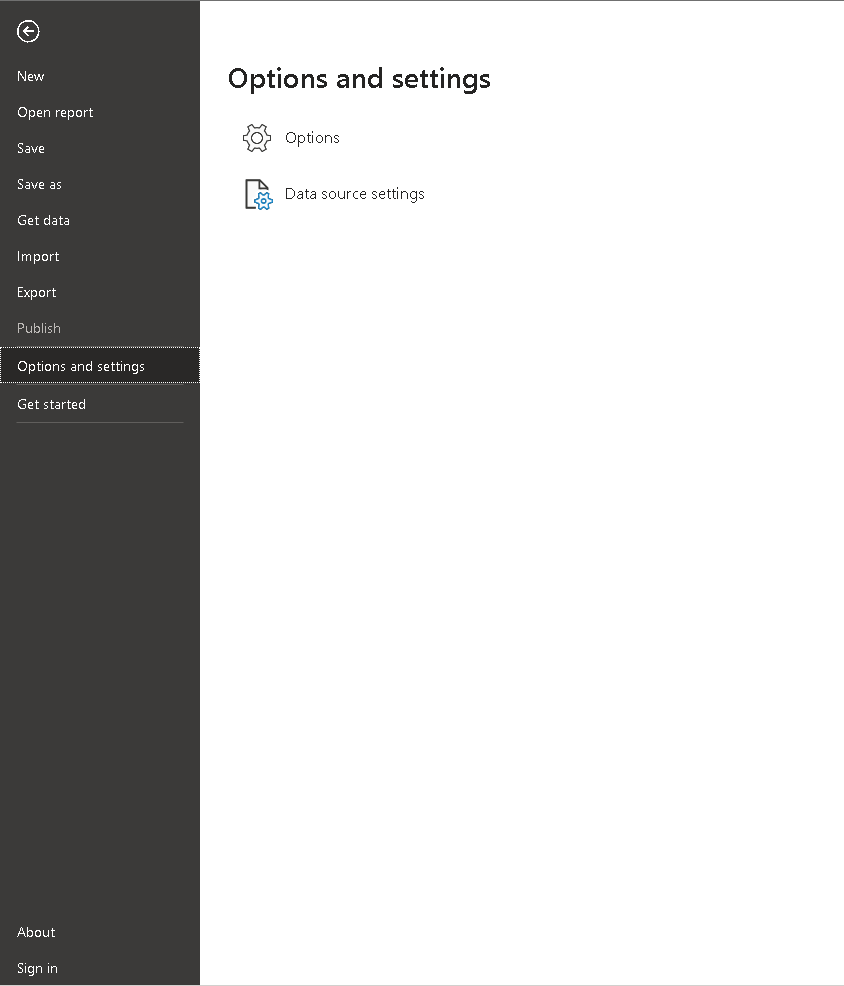
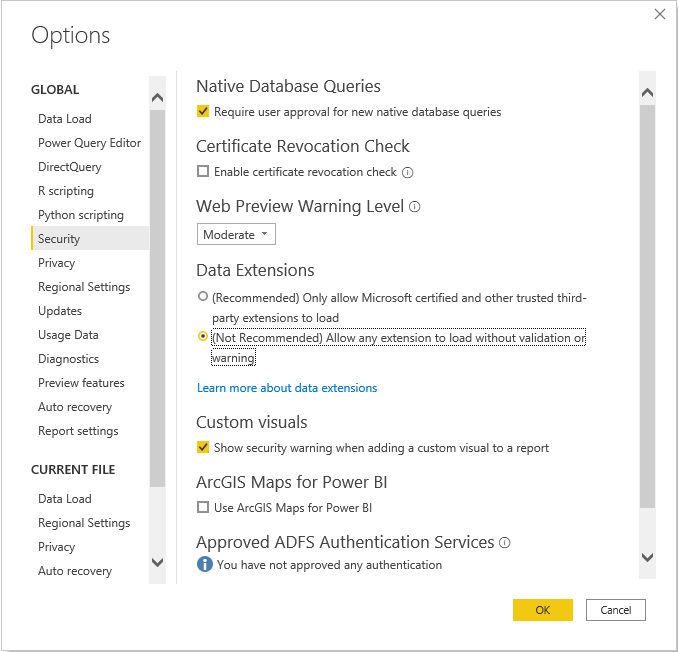
The data connector could be recognized by its .mez extension. The file has to be placed in the folder 'Documents\Power BI Desktop\Custom Connectors' in the current user. If the folder does not exist, create it. Moreover, to actually load the extensions in aforementioned folder, we need to change a setting in Power BI: In 'File → Options and settings → Options → Security → Data extension' select '(Not recommended) Allow any extension to load without validation or warning'. Now restart Power BI.
In some cases, only a signed or trusted connector can be used. For this, there is a self-signed version with a pqx extension available with the thumbprint A28548EDB0467E017E48B322C3733FBD4756930E.
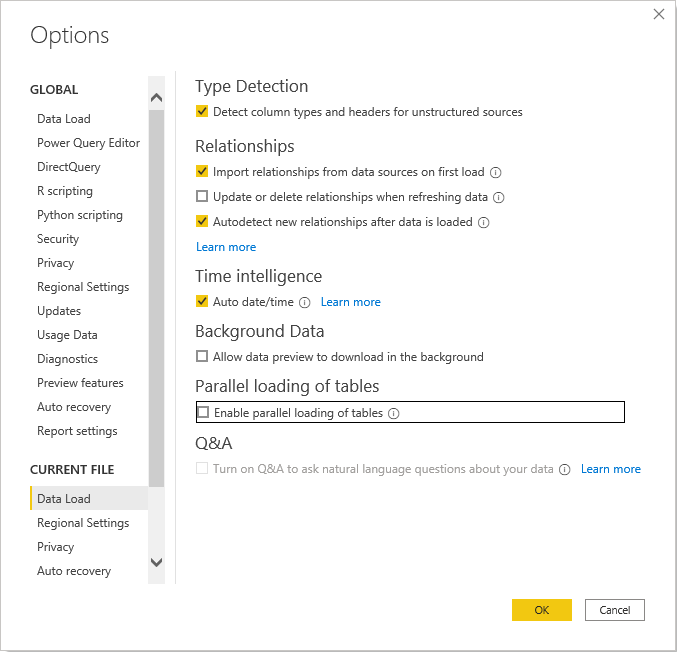
There are a few settings in Power BI which are configured per file. A couple of them are options which could release stress on the server. For larger ClockWise environments, it is recommended to adjust these settings before creating the data connector.
In Power BI, go to 'File → Options and settings → Options → Data Load (Under Current File)'
Turn the following options off:
The latter of the two is the most important to turn off: Otherwise four (possibly big) tables are downloaded from the server at the same time, which could give stress to the server.
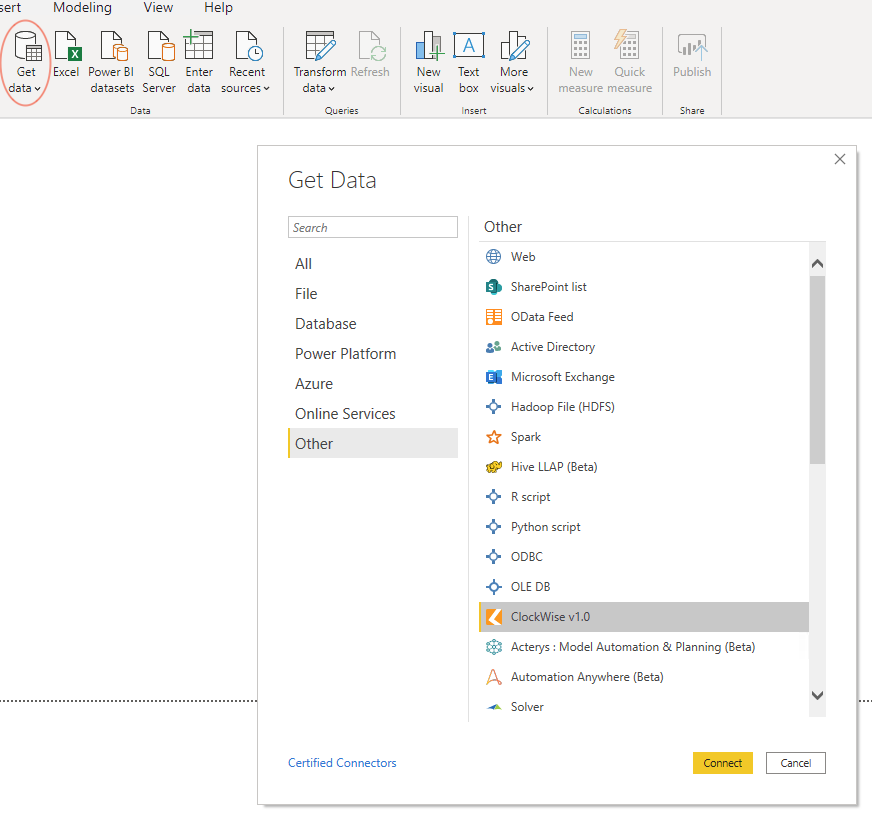
To retrieve the information from ClockWise via the Data Connector, you need to click in Power BI on 'Get data'. Now a menu is shown with all data connectors in Power BI. Click on 'Others'. You will find the data connectors from ClockWise, named 'ClockWise v1.0'. After choosing this connector, click on 'Connect'.
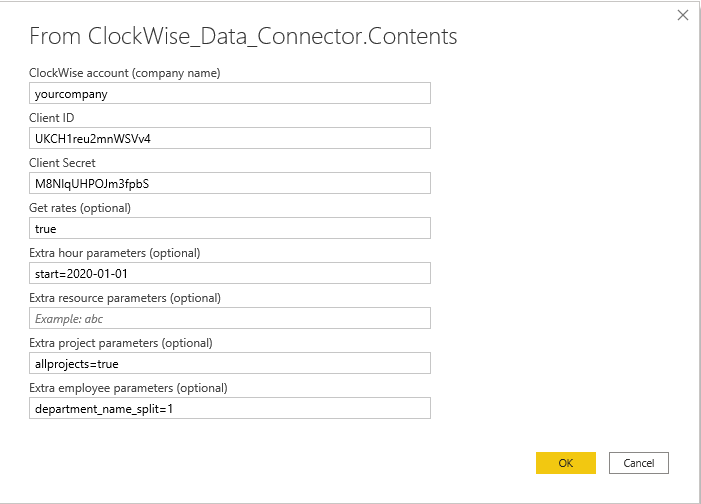
Now click on the background. A popup is shown with eight fields. Those fields are respectively:
The next window that will be opened the first time you make a connection with this ClockWise environment, Client ID and Client Secret is the login screen. It will say that you are not signed in, and featue a 'Sign in' button. By clicking on this button, a popup is opened with the ClockWise Login page. Log in with your ClockWise credentials. Now click on Connect.
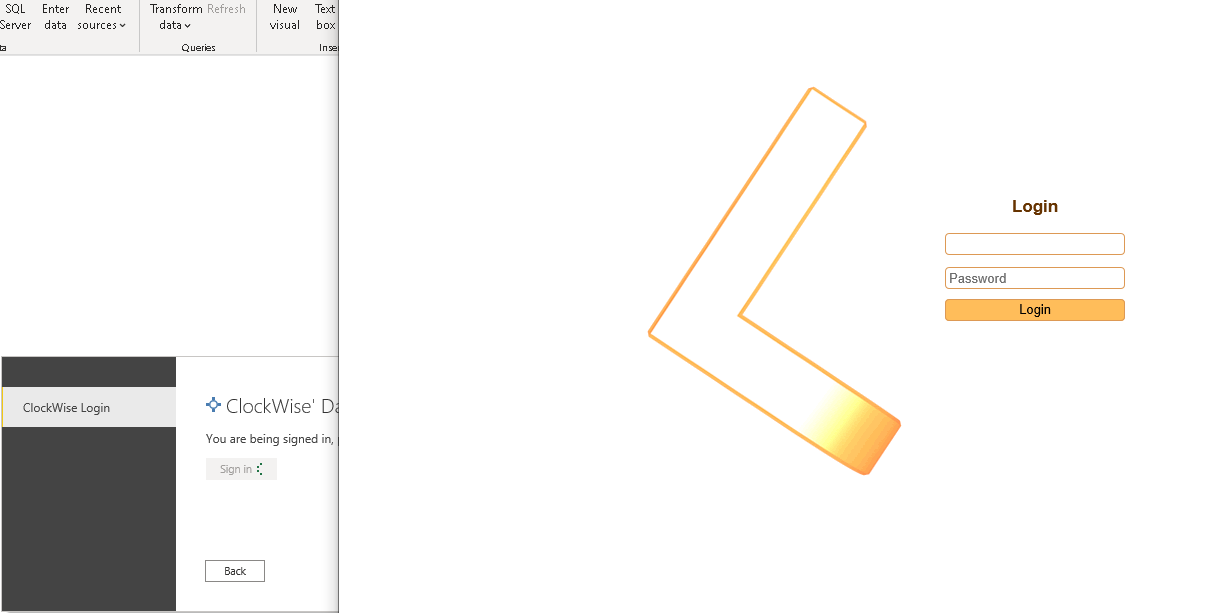
If you logged in before with the same ClockWise environment, Client ID and secret, this screen is skipped. If you would like to login as a different user, you could go to 'File → Options and Settings → Data connector settings'. There you could edit the credentials of any data connector you loaded, logging in as a different user.
Now yet another window opens. If you chose the 'ClockWise' connector, this window featurs four tables: Employees, Projects, Resources and Hours. By selecting any table, Power BI could give a preview of a few rows and all columns of a table, however this is not recommended for large environments, as it needs to retrieve the data twice. This could give a lot of stress to both Power BI and the server. It can be turned on or off in the setting just above those four tables.
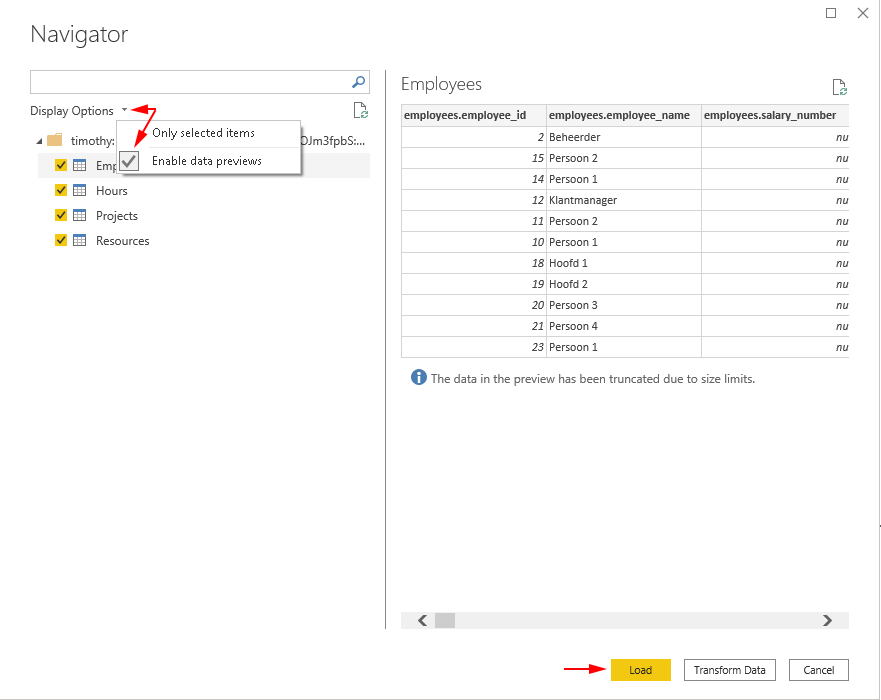
Now choose the tables you want to retrieve, and click further. Power BI will calculate, initialise the tables and retrieve the data. If Power BI is ready, the data could be used to create visualisations.
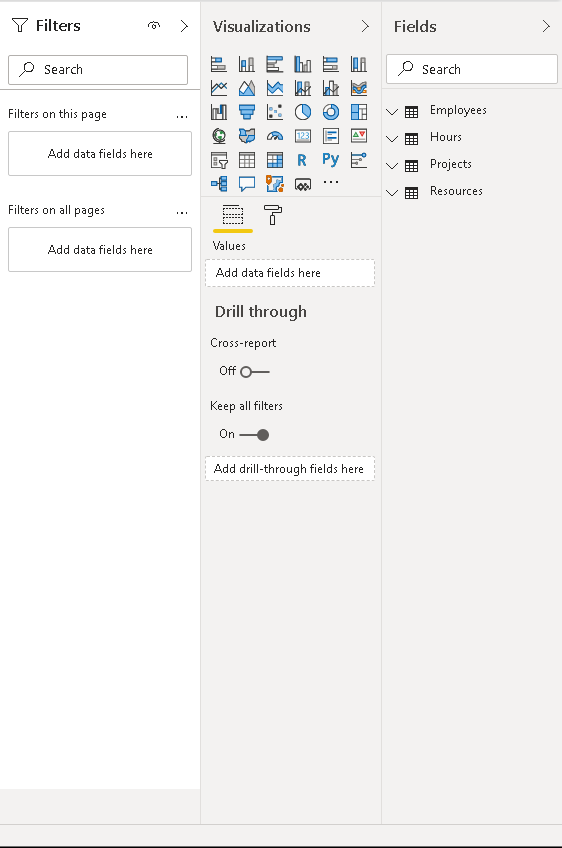
Power BI could refresh the data, so it is not necessary to recreate the connector if something changes within ClockWise. However, if the parameters need to be adjusted, like the start and end dates, you need to recreate the connector to enter the new parameters.
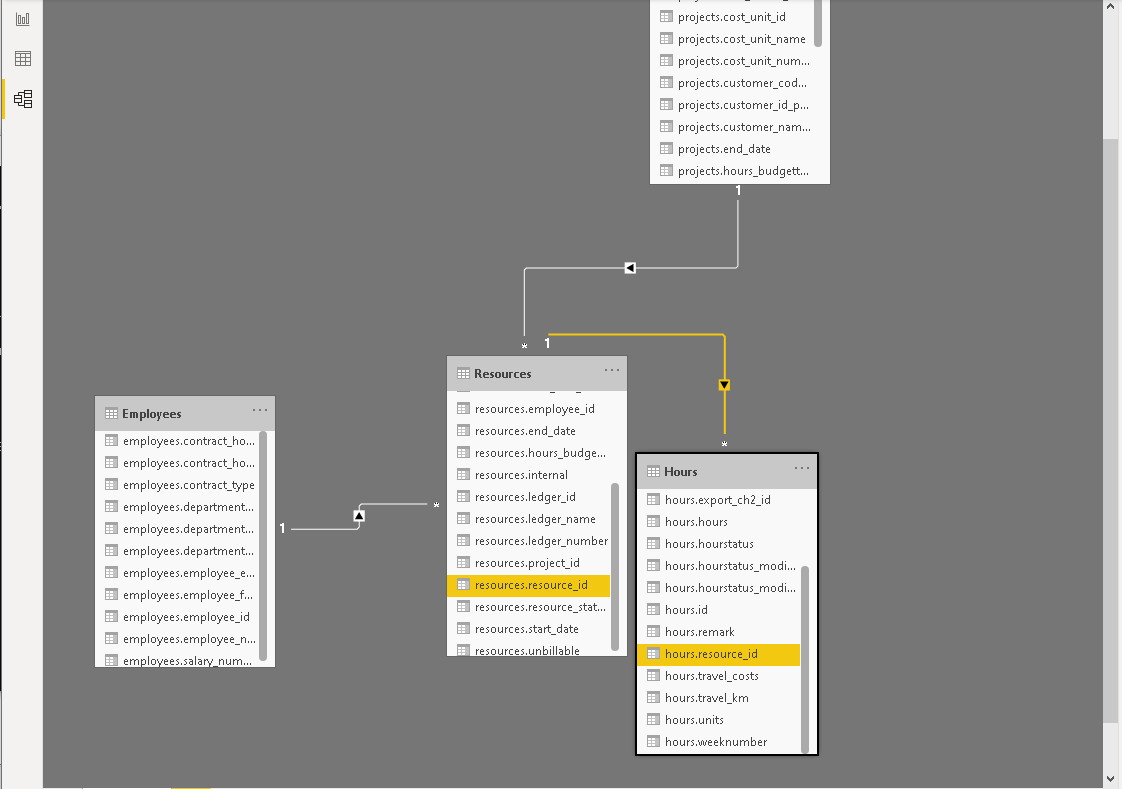
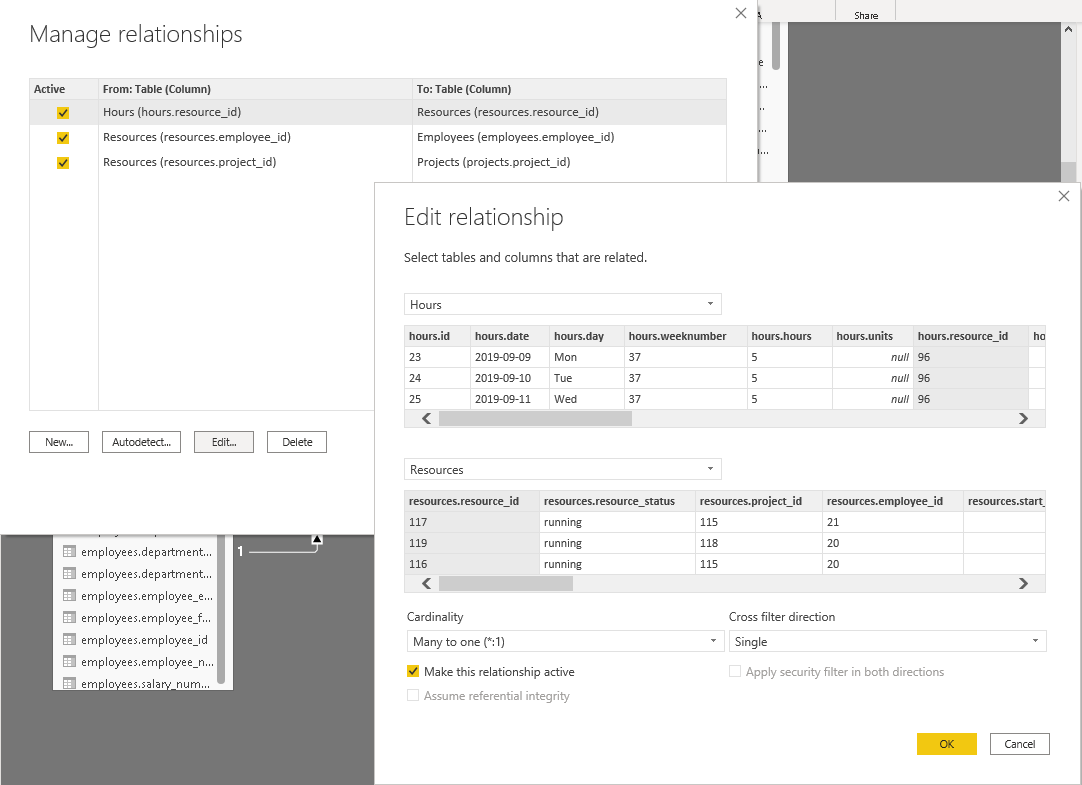
When using the 'ClockWise' data connector, multiple tables get loaded. PowerBI tries to relate these tables together, based on the column names with the same name (e.g. 'hours.resource_id' in the Hours table gets coupled with the 'resources.resource_id' column in the Resources table). Unfortunately, this will not always go correctly. Besides, when you load data from a different source altogether which needs to be coupled to data from ClockWise, you will need to configure the relationship yourself. To do this, go to the relationship overview (third button on the left side). There is an overview of the different tables, with lines between them with either a 1 or an *. When hovering over the line, the columns of the tables which are couples gets highlighted. To make these relationships, there are two possibilities: By dragging a column from one table to the corresponding table in the second table, or by clicking 'Manage relationships' in the menu on top. You will see a window with all the relationships defined, where you can turn them on or off, delete them, edit htem or make new ones. In that case, you see a window with a selection for the first table, a preview of that table, a selection for the second table and a preview of the table. Below there are configurations of the relationship. Select the tables which need to be linked, and in the preview the corresponding columns. Press 'OK' to create the relation.
The relations which should have been made by PowerBi are:
- hours.resource_id ↔ resources.resource_id
- resources.employee_id ↔ employees.employee_id
- resources.project_id ↔ projects.project_id
The following table gives an explanation of the most used fields in Power BI. Most of them will be self-explanatory.
As a general rule of thumb, the id fields are not necessary for graphing purposes. A few of those are needed to connect the four different tables to each other, but those relations should be there already (see the 'Managing relations' section above).
| Power BI | <=> | ClockWise |
|---|---|---|
| employees.contract_hours_min | Minimum contract hours of the employee | |
| employees.department_name_path | Path of department names (by default separated by ' / ') | |
| employees.employee_email | Email address | |
| employees.employee_name | Name | |
| employees.salary_number | Salary number | |
| hourly_sales_rate | Hourly sales rate (available in all tables if 'retrieve rates' is set to true) | |
| hourly_purchase_rate | Hourly purchase rate (available in all tables if 'retrieve rates' is set to true) | |
| hours.date | Date | |
| hours.hours | Amount of hours | |
| hours.hourstatus | Hour status (written, submitted, approved or rejected) | |
| hours.units | Units associated with the hour entry | |
| projects.customer_name_path | Path of customer names (by default separated by ' / ') | |
| projects.end_date | Project deadline | |
| projects.hours_budgetted | Budgetted project hours | |
| projects.project_name_path | Path of project namen (by default separated by ' / ') | |
| projects.start_date | Start date of project | |
| resources.resource_status | Resource status (running, closed or in_preparation) | |
| employee_id | Employee identifier. Is used in the relation between the resource and employee tables | |
| project_id | Project identifier. Is used in the relation between the resource and project tables | |
| resource_id | Resource identifier. Is used in the relation between the hours and resource tables |
There are other similar fields to the ones listed above, for instance project_code_path, yielding a path of project codes instead of project names. These are not listed to keep the table short.
Keep in mind that (in the last example) the similar named project_id_path is probably not the field to use, unless a connection with another table (with project entries) is needed.
The data connector has a number of functions for the power query editor: The underlying function of the two connectors could be found there, as well as a third function from which information from one of the API endpoints could be retrieved.
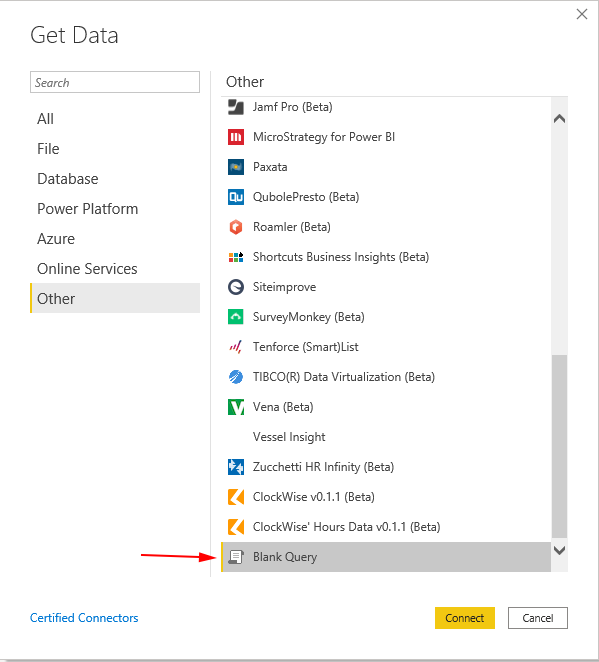
To use the editor, go to 'Get Data → Others → Blank query'. The Power Query Editor will be opened. Press 'Advanced editor'.
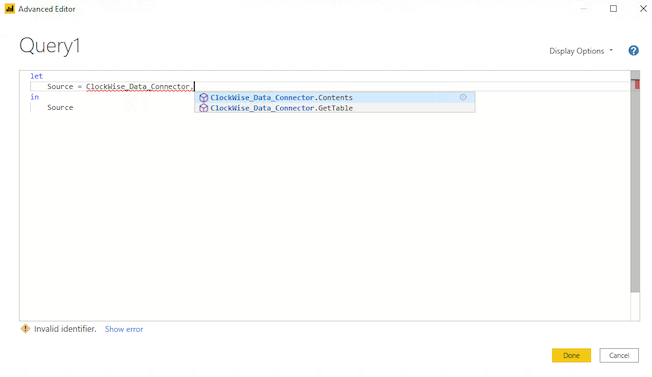
A window will be opened with the text (on different lines): 'let Source = "" in Source'. Remove the double quotes and type 'ClockWise_Data_Connector.' with the name of the function you want to use. There are different options:
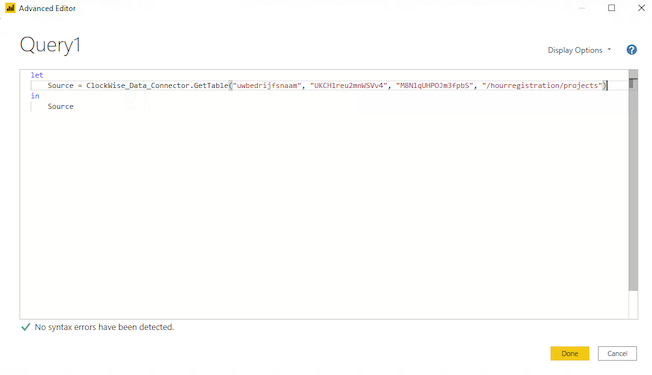
For the complete documentation of M, the language of Power Query, see https://docs.microsoft.com/en-us/powerquery-m/
In this case we show how you can sum hours on sub project level, together with other information of that same project.
We use the following project structure:
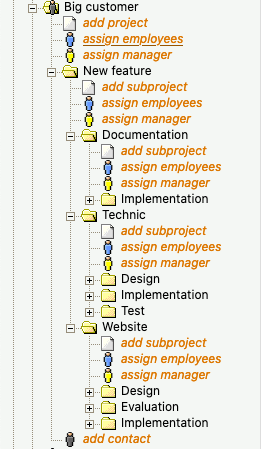
We want to graph the total hours of each of the projects "Documentation", "Technic" and "Website" together with the budgetted hours in Power BI.
To accomplish this, we need the following parameters in Power BI:
start=2020'01'01.allprojects=true&project_name_split=1,1&project_id_split=1,1Now, the following fields are loaded in Power BI: "project_name_1" (contains "New feature"), "project_name_2" (the one we are interested in), and project_name_3 (containing "Design", "Implementation", etc.).
Check the following column names in the column on the right: "project_name_1", "project_name_2" and "hours_budgetted". Now make a new quick measure:
Drag the quick measure from the column on the right to the table.
Now there are two rows per sub project: one containing the sum of the hours, and one with the budgetted hours. To solve this, select 'First' in the menu of "hours.hours_budgetted" in the "Values" section in the middle column on the right. With that, the rows are combined.
Note: This works with all fields of the sub project, not just with budgetted hours.
It is possible that there is a whitelist of URLs allowed in your company. If an error is given, it might be possible that the URL https://oauth.powerbi.com/views/oauthredirect.html is blocked by the whitelist, so that PowerBI cannot finish logging in.
There are two ways to do this:


